Mobile Power Meter Application
 So in this article, we’re going to switch from the power meter itself to the mobile application that serves as the remote display. The power meter application is a cross-platform application for Android, IOS, MacOS, and Windows. The application starts up by searching for any and all power meters that are powered on and within range of the application. The application will take about 15 seconds to enumerate all active power meters. If no meters are found the application will return a message to tap and search again.
Main RF Measurement Screen
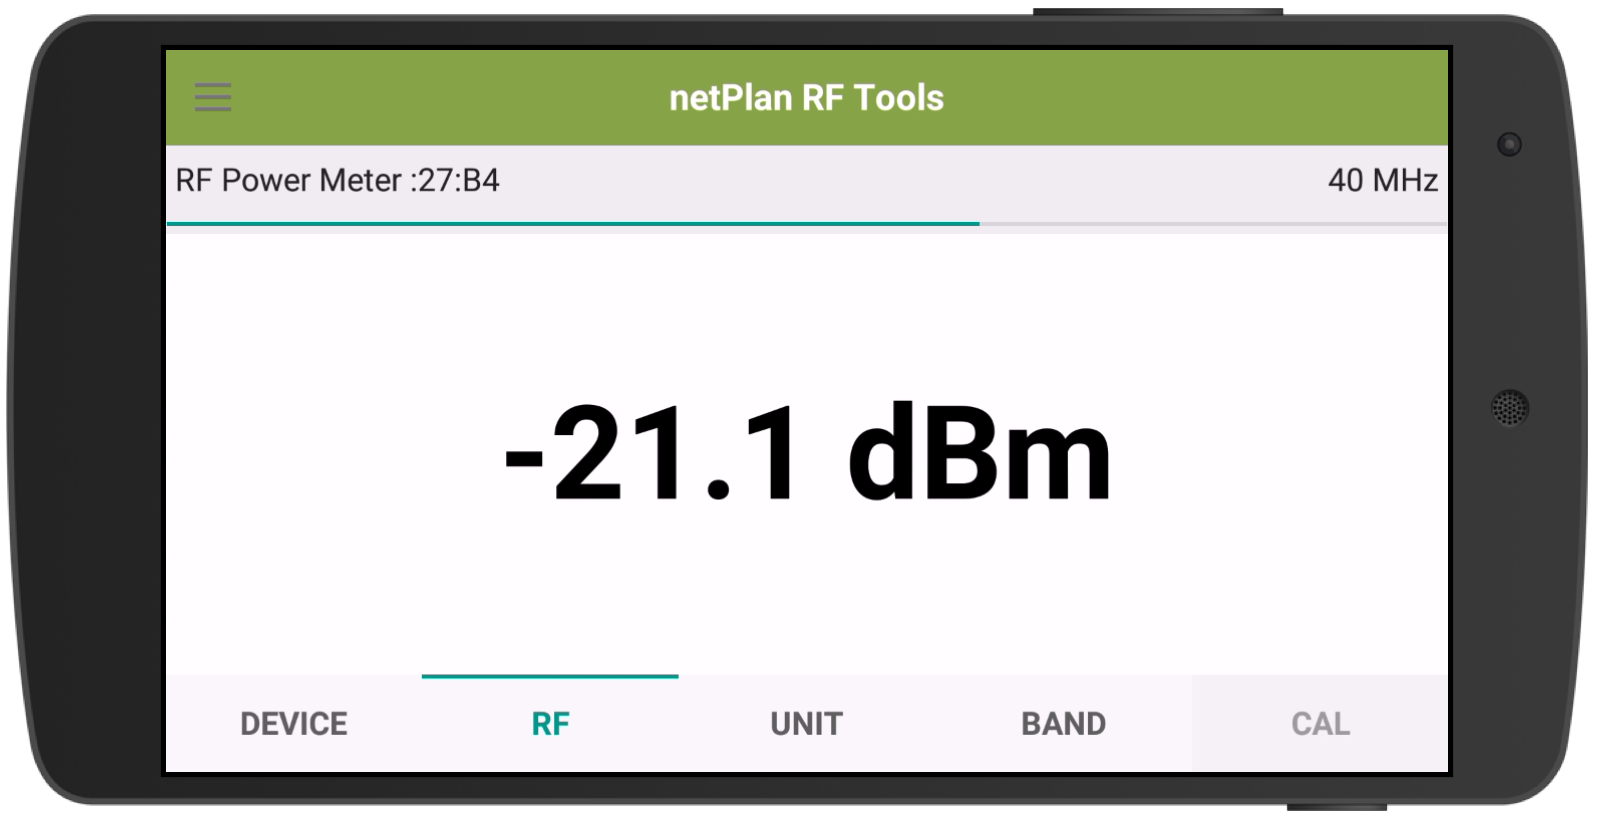 Once the mobile device has found one or more meters it will connect to the first meter it detected and automatically switches the application to the RF tab and displays the measured signal strength. The main screen displays the current band setting in the upper right. A thin bar graph just below the band label indicates the signal strength relative to the full dynamic range (-75 dBm to + 10 dBm). The tabs along the bottom allow the user to configure the band setting, units displayed, calibration data, and a list of the enumerated sensors.
The user can also display the statistics panel by tapping on the up/down arrow. The statistics panel will show the minimum and maximum signal strength as well as the total number of measurements collected. Users can reset the statistics by pressing the Reset button. The statistics panel is available on both the primary RF screen as well as the secondary RF screen which shows the RF measurements over time in a graph.
RF Measurements Over Time
The secondary RF screen can be accessed from the main RF screen by swiping to the left. The graph shows the minimum, maximum and current signal strength over time. Resetting the statistics panel will automatically reset the graph as well. To go back to the main RF page simply swipe to right. The current measurement is shown in blue, the maximum is shown in red and the minimum is shown in green. This graph will also automatically reset if the band or the units are changed.
List of Sensors
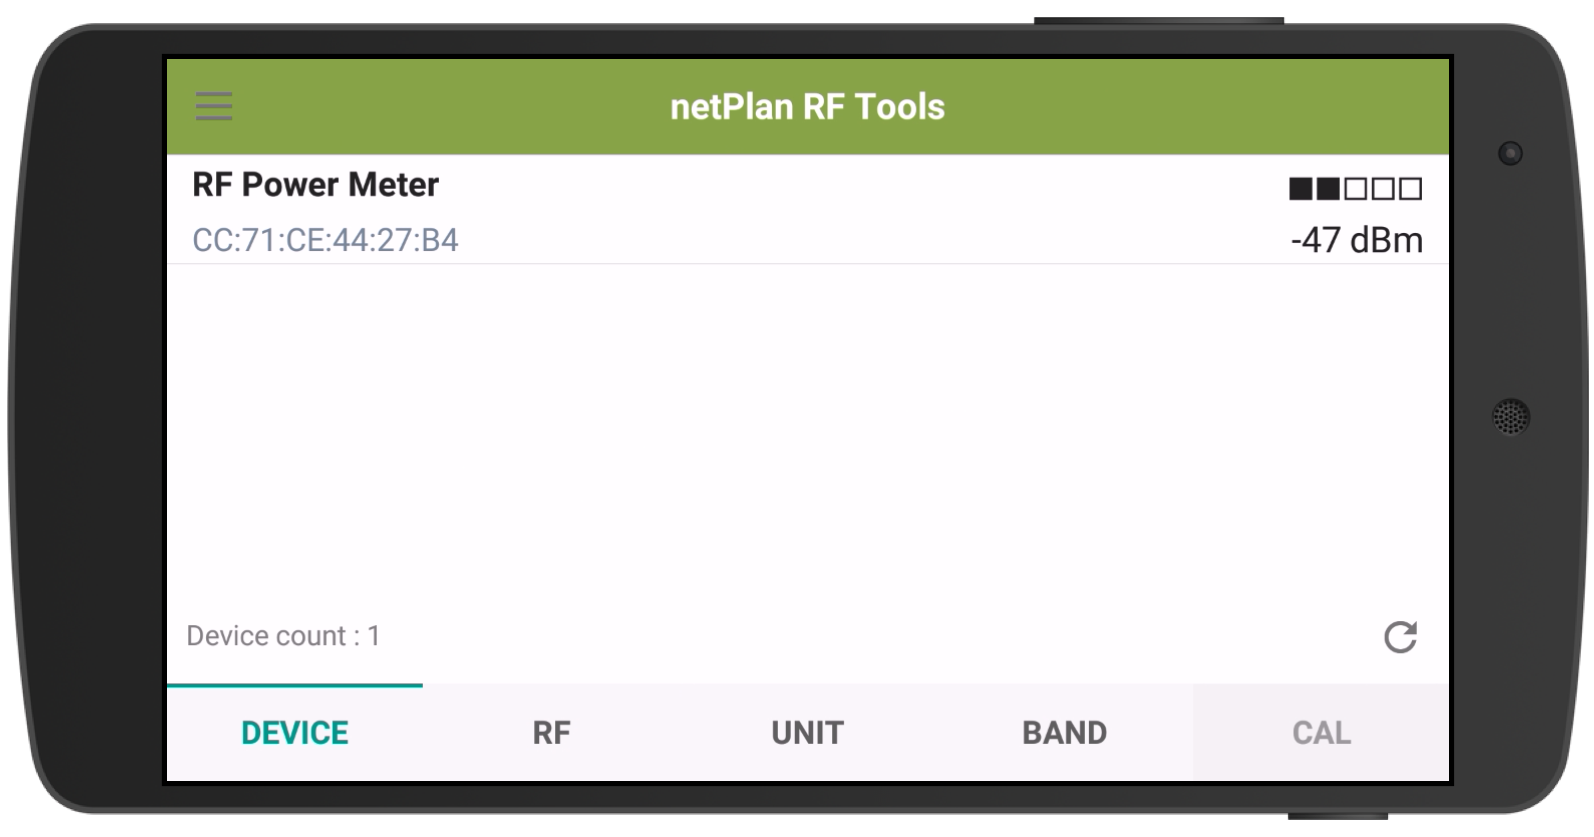 The sensor or device screen allows users to connect to any number power meters within range. Simply tap on the meter name and the application will connect to the desired meter and start recording measurements. The signal strength indicator shows the received signal strength of the Bluetooth module at the mobile device. The sensor screen will be expanded in the future to include additional devices (i.e. Hand-Held RF Power Source). The RSSI on the sensor screen is refreshed once every five seconds. Note: The update refreshes the status of the previously enumerated meters it will not automatically add any new meters. To force the application to re-enumerate the sensors swipe down on the sensor screen.
Units
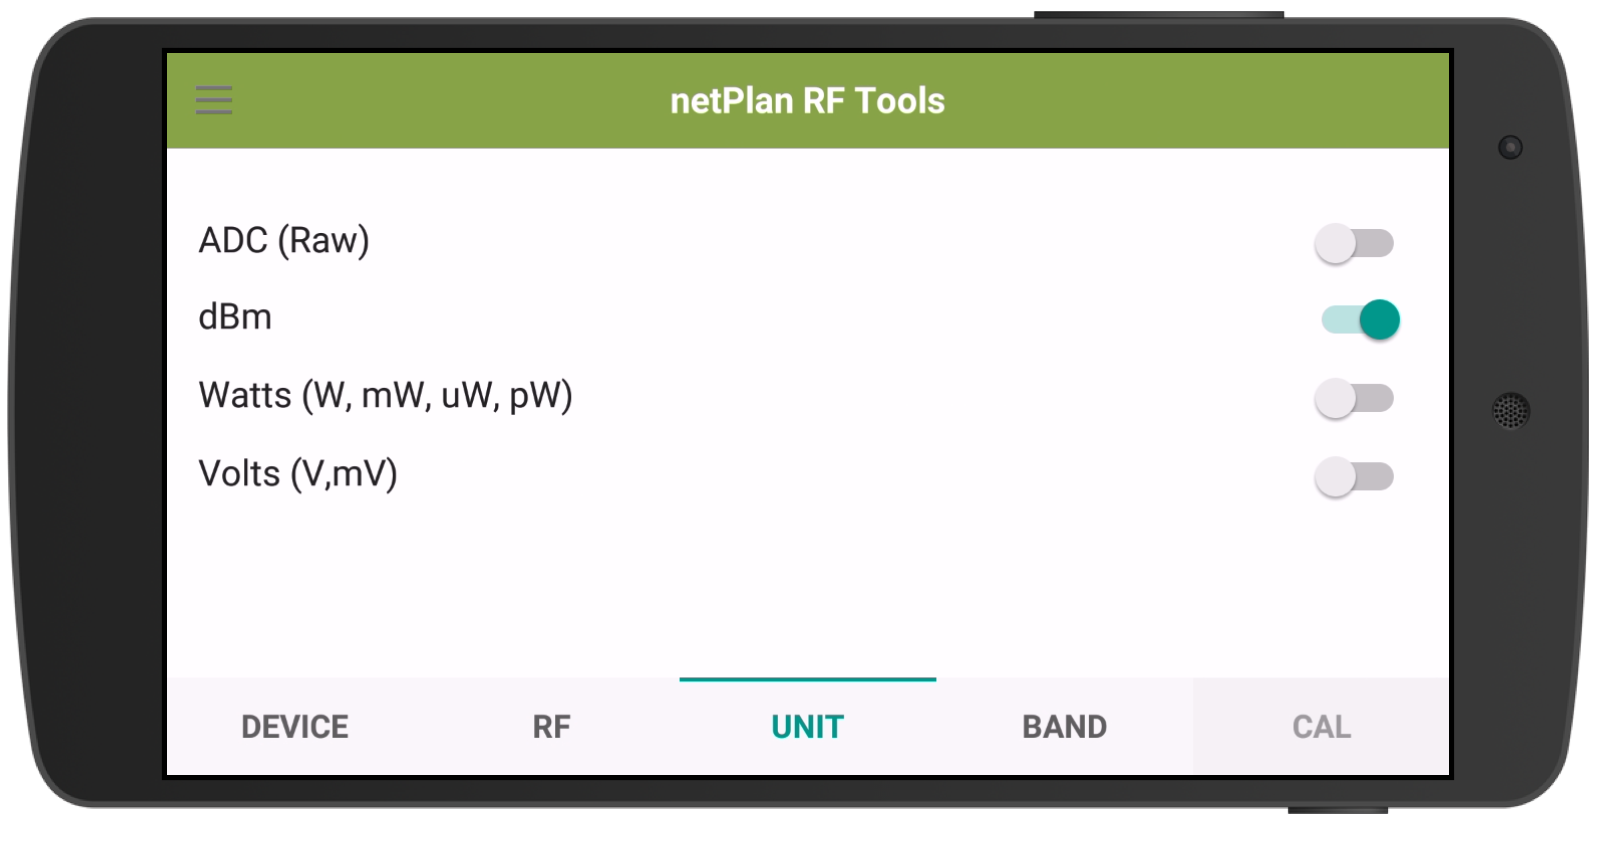 The current version of the mobile application supports the following units:
– ADC (Raw)
– dBm
– Watts (W, mW, uW, pW)
– Volts (v, mV)
The ADC unit is really only used for calibration, and should not be used for collecting measurements. The Watts and Volts units automatically auto range, based on the received input signal level to the meter. The default unit type is dBm. The measurements are stored on the device in raw format (ADC). This allows the calibration tables to be reapplied after the fact, or new calibration data to be applied to the measurements after the measurements are collected.
Low and High Power Warning Screen
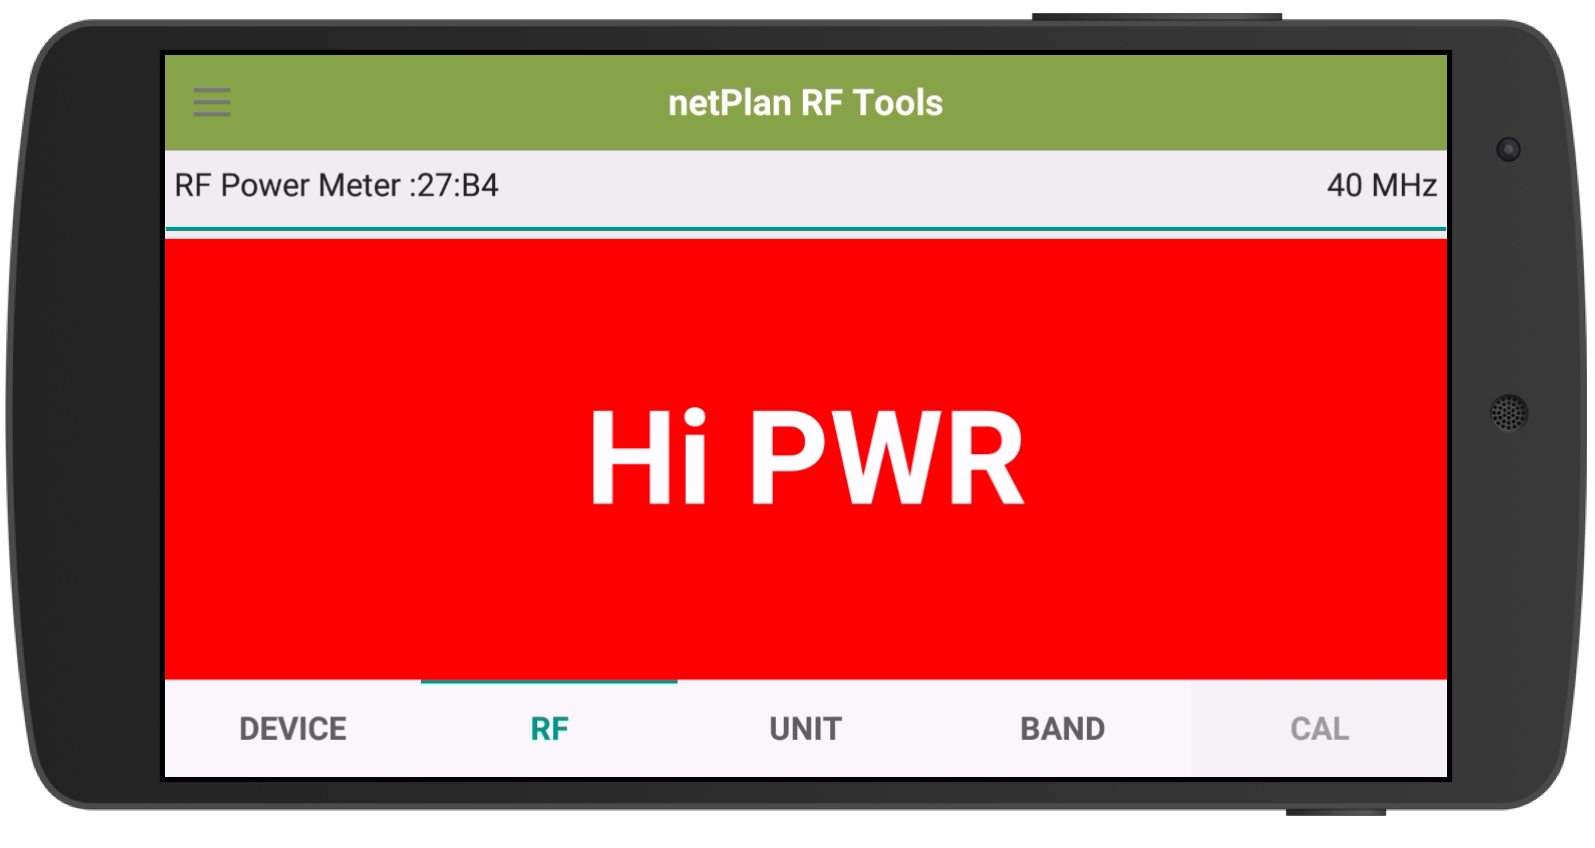 The high power warning screen takes over the main RF screen with a flashing red “HI PWR” warning message. The phone also beeps while the meter detects high power. The high power warning appears on the screen when the RF input exceeds +5 dBm. The RF sensor can survive RF levels up to +15 dBm. The meter will provide calibrated RF measurements signals between +10 to -70 dBm
Calibration and Band
The calibration screen allows a user to check the accuracy of any of the six bands by displaying the measured vs the recorded calibrated result. Simply inject a signal at a known level for the chosen band and check that the ADC (measured) is approximately equal to the ADC (Default i.e. Calibrated). The user can choose to apply the measured value for the known signal, overwriting the previous value. The updated calibration value will be used from that point on. Users can choose to adjust single values or an entire band using this process.
 The default calibration tables can be restored by pressing the Restore button. However, if you choose to Restore the default calibration tables ALL the values are restored not just the current band. I fully expect that in the future the restore feature will have a few more options, for example, All bands, or just the current band.
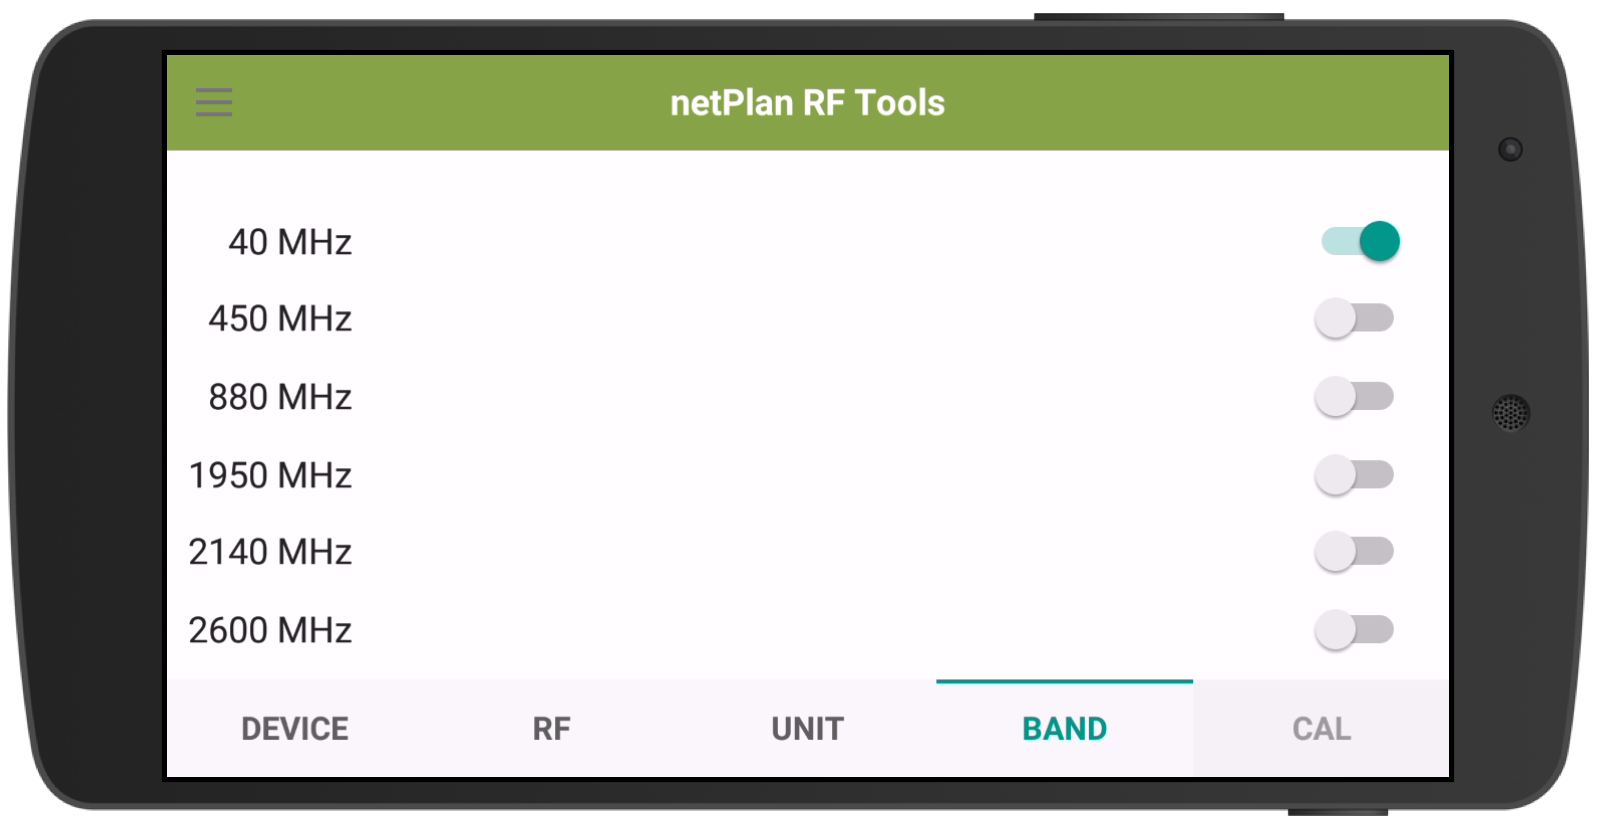
The band screen effectively switches been each of the six calibration tables. To get the best accuracy users need to choose the band that most closely reflects the frequency they are about to measure.
 Project Settings
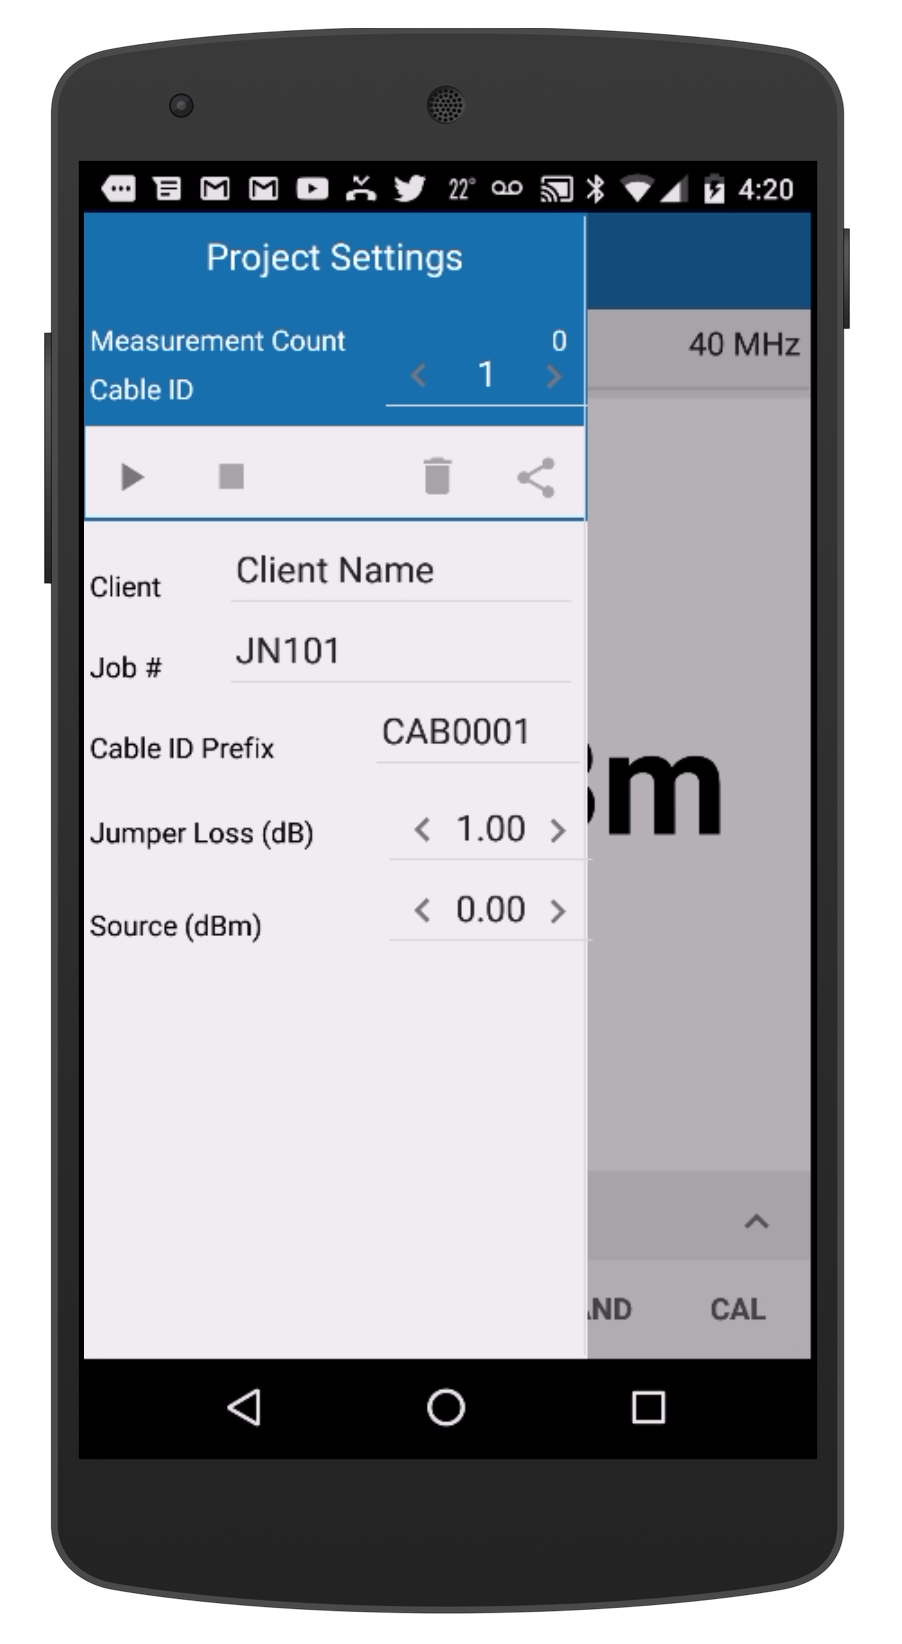
One of the key requirements for this project was the automation of the data collection process. The point was to eliminate the need for paper and pen or even a laptop in the field. With the RF Power Meter and the mobile application, data collection is now consistently collected and can be uploaded to the office at any point.
Users upload a cable project containing the cable ID’s and the expected insertion loss directly into the mobile application. Once data collection starts they simply select the cable ID and press the record button the application records the measurement. The setup process sets the test jumper loss, and the application calculates the insertion loss for each cable in the project.
Wrap Up
So this is where we are going to end this series, hope you found it mildly interesting. If you have a question or comment enter them below.
That’s it for today. Cheers.

